My curiosity about complex systems and their application in finding solutions for the intrinsically complex that is urban (social and resource utilization) systems led me to this beautiful equation.
The equation is simple:
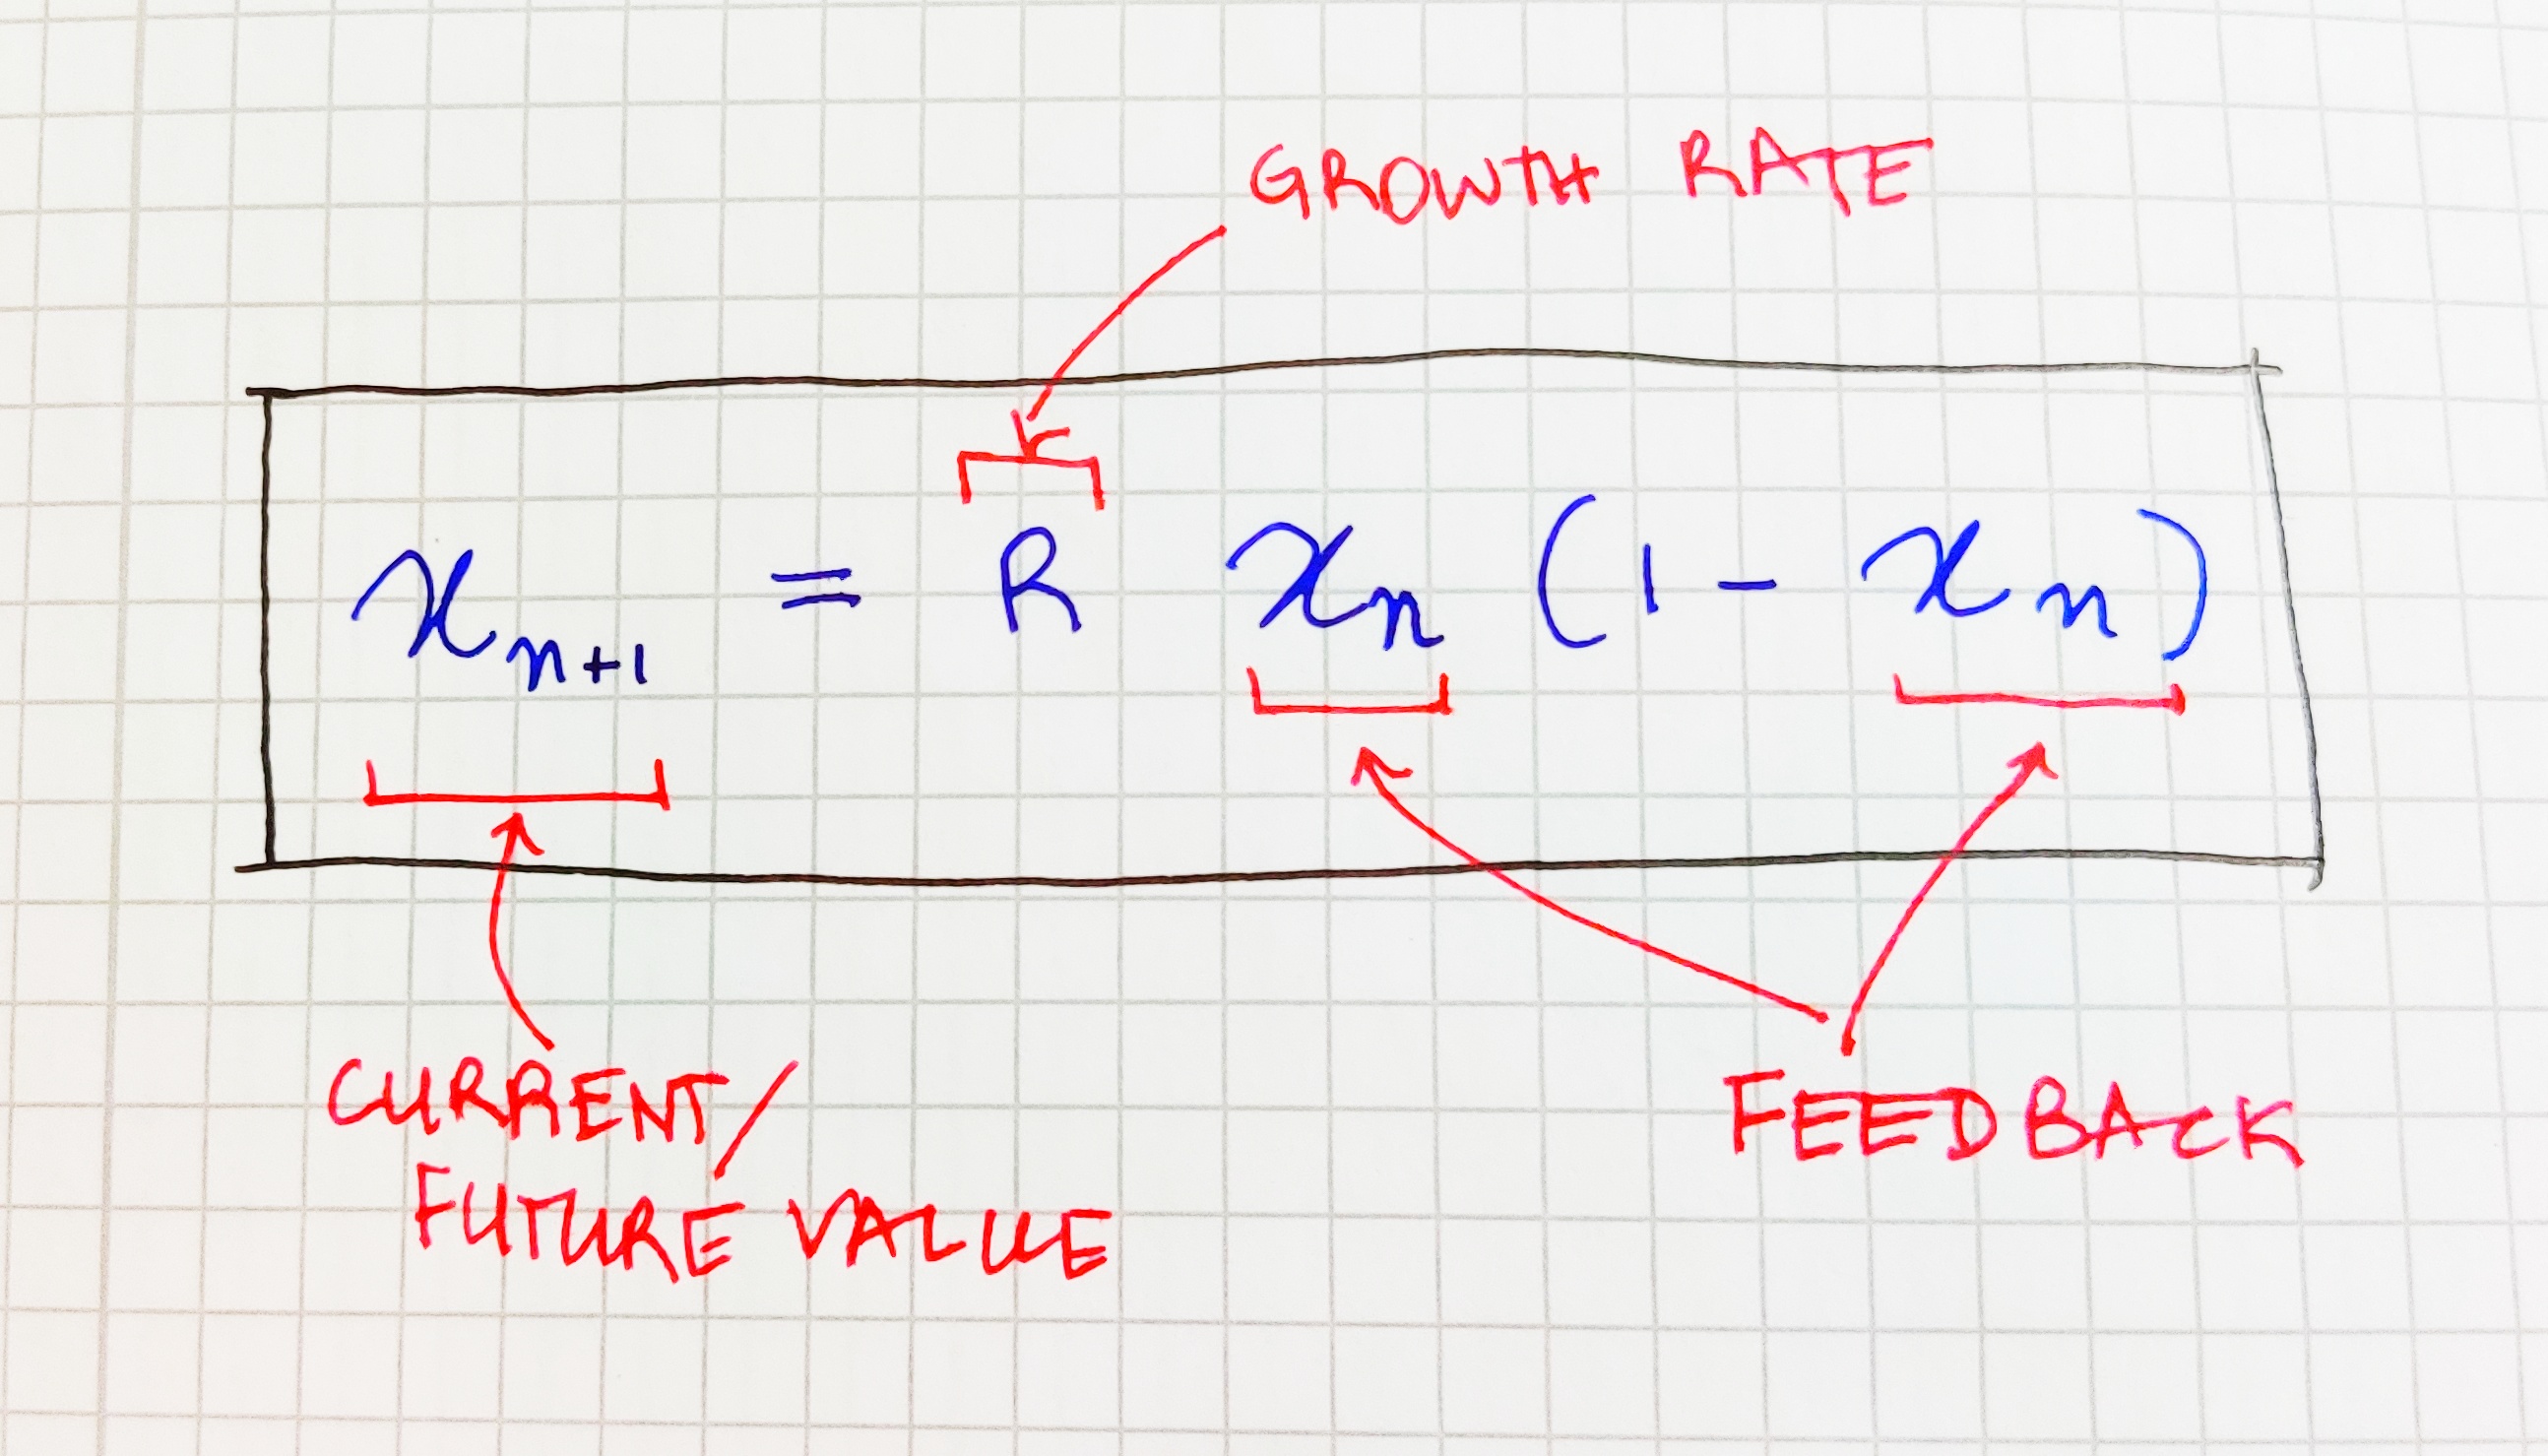
What makes this simple equation behave stochastically, create a bifurcation graph and go into absolute chaos after running for some time is the FEEDBACK. It runs for some time normally and the graph suddenly goes from a curve to bifurcation (2 curves), then there are more branches to this truck of the tree and more - like branches of an actual tree. Simply explained X at t of (n+1) is a result obtained from X at t of n (the previous step. A helpful way of picturing this equation is through a population growth scenario of a settlement which grows from nothing to a thriving metropolis, where the growth rate includes a floating population of tourists, short-term residents and marginal workers who come in for a few specific months to earn their living. The stochasticity over some time could be nicely explained by this.
Here is another place where you can find out more about the Logistic Map equation.