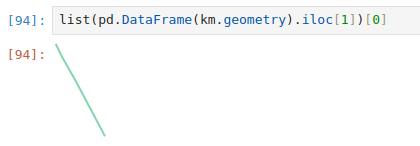
Today, accidently, I plotted a line using ‘list’ in python!!! While wanting to get a list of ‘geometries’ from a road network from a geopandas dataframe, it plotted. But its a single geometry. So may not be very useful for doing a visulization of anything except maybe a single polygon (boundary). Still a surprising find!
Screenshot:
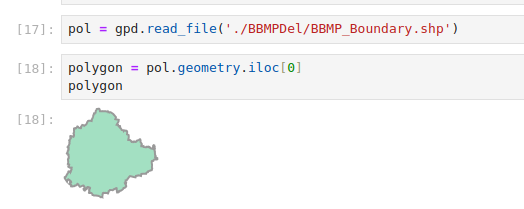
The one below also shows a shape when printed (and saved, it can be used in NetworkX/OSMNX graph), which is similar to the one above - plots the geometry directly.