Causal Inference: rail network is a key driver of migration flows in India
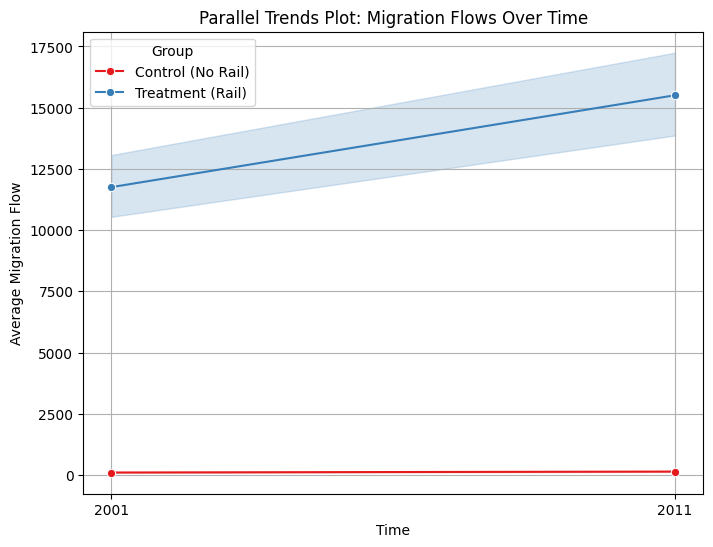
I used network analysis, causal analysis and econometrics to get to the results. I analysed if rail routes had any (causal) effect on migration patterns in India using Difference and Differences. Read more about it here
Bangalore’s Road Network Analysis
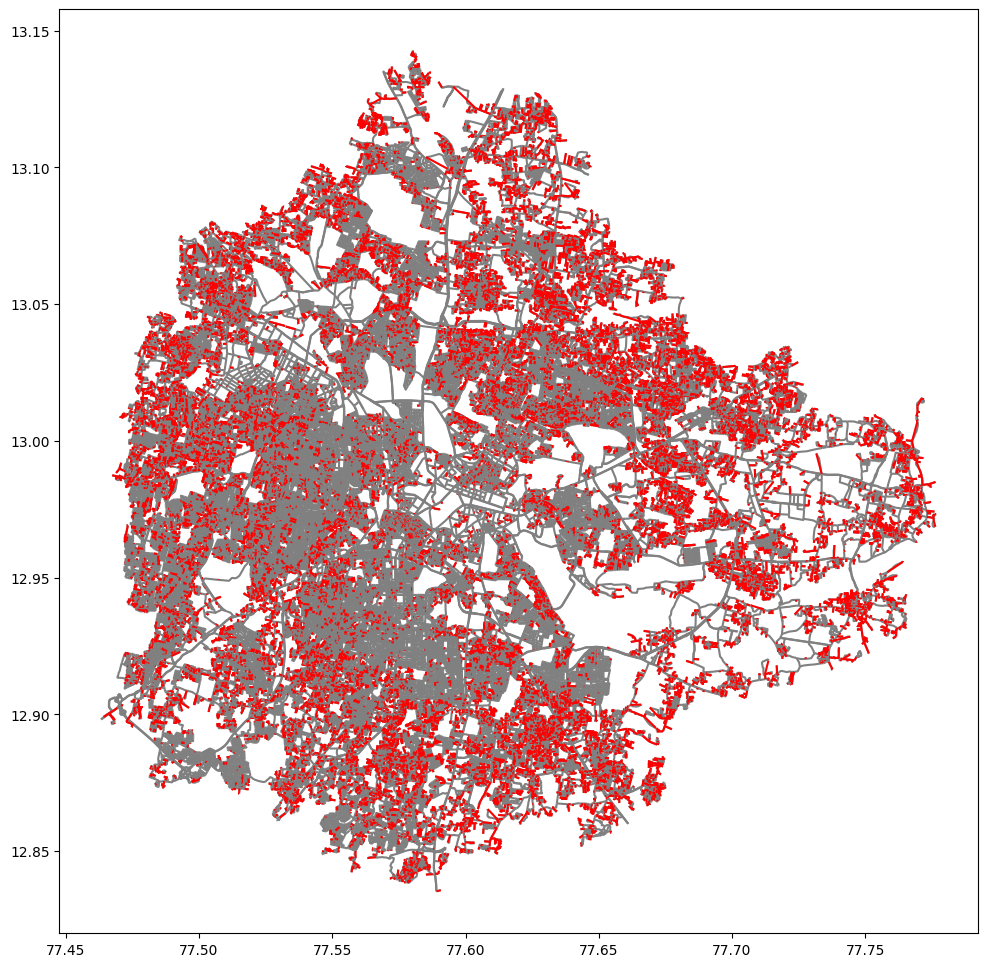
Bangalore is known for being a city with one of the worst traffic. I analysed Bangalore’s road network using osmnx and networkx in python. Read more about it here
Gini Index and Lorenz Curve Scenarios
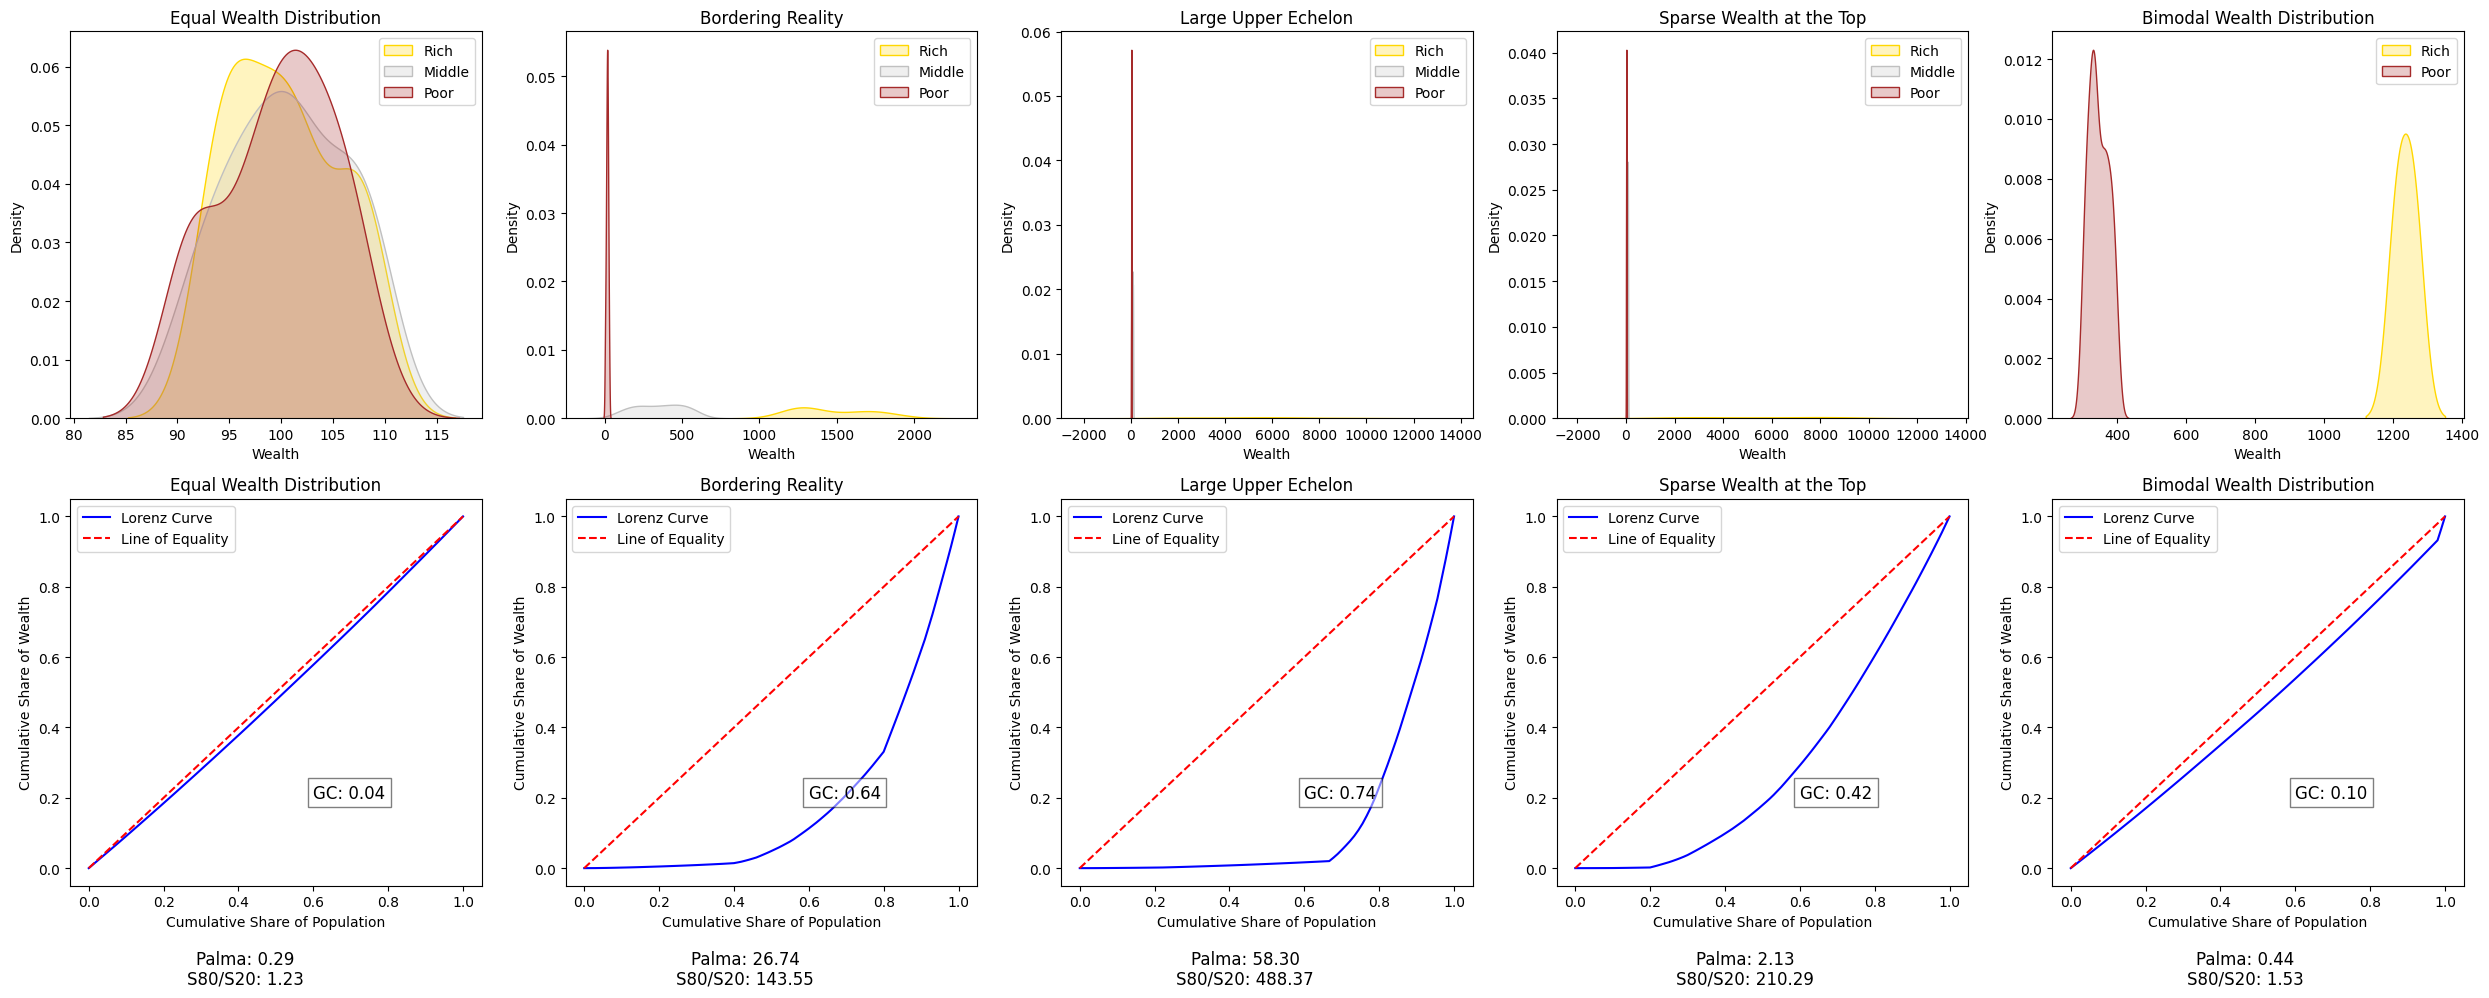
I visualized how the Lorenz curve and the gini index looked for different scenarios, by making up data using random numbers in a range in python. Read more about it here
Emotional Arc of the Most Read Book in the World
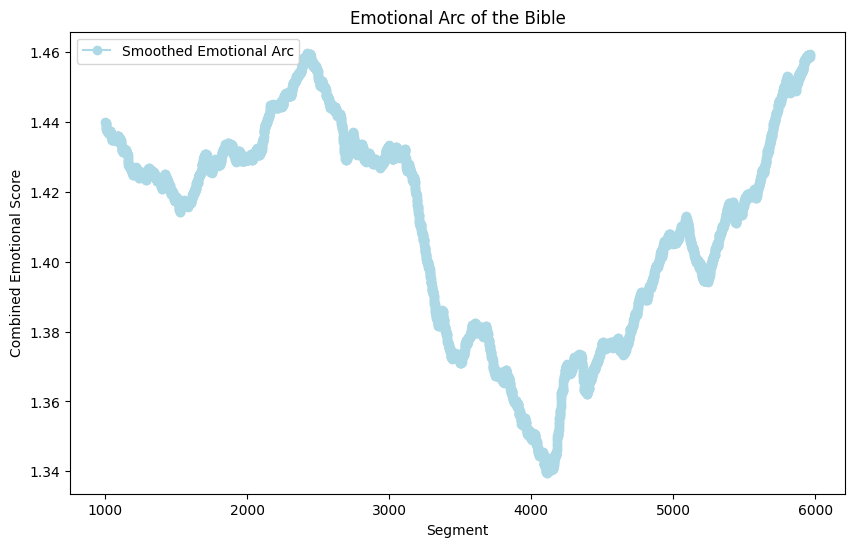
The Rise-Fall-Rise emotional arc of the Book. Sentiment analysis and emotional arc of Bible. Read more about it here
Which districts have potential for growth according to migration patterns?
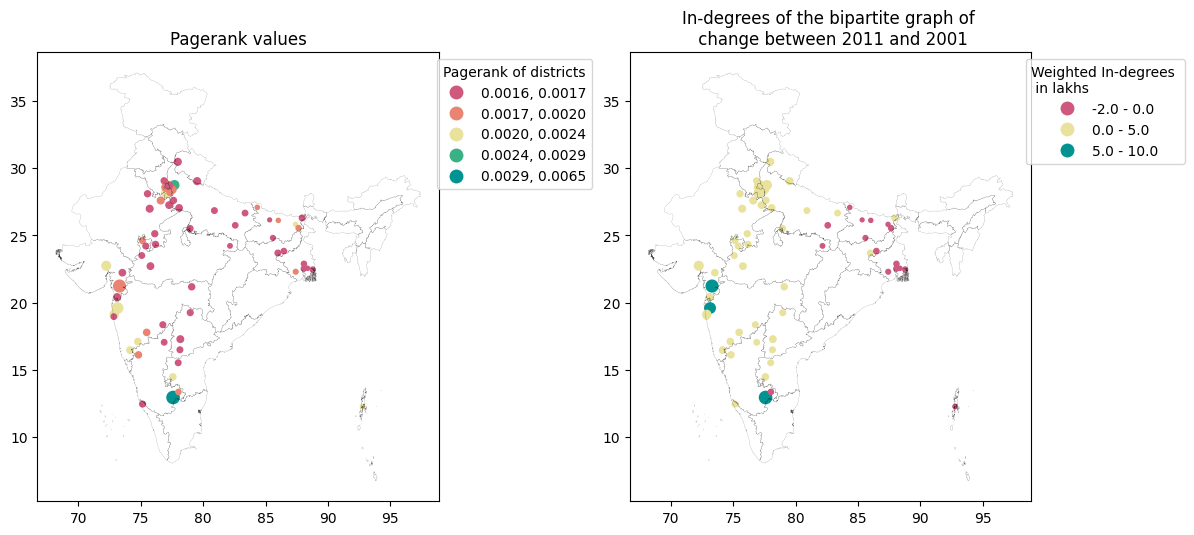
To learn more about Network analysis, I undertook a project to look for prominent districts based on Census of India Migration data for 2001 and 2011 using Network Analysis. This data consists of inter-state migration numbers from states to districts. I used Networkx in Python. Read more about it here
Joining the Census of India 2001 and 2011 data
The final result of monumental task of joining the Census of India 2001 and 2011 data - with district names and population data for both decades is put up here. Read more about it here
Cities in Books from a colleague’s website
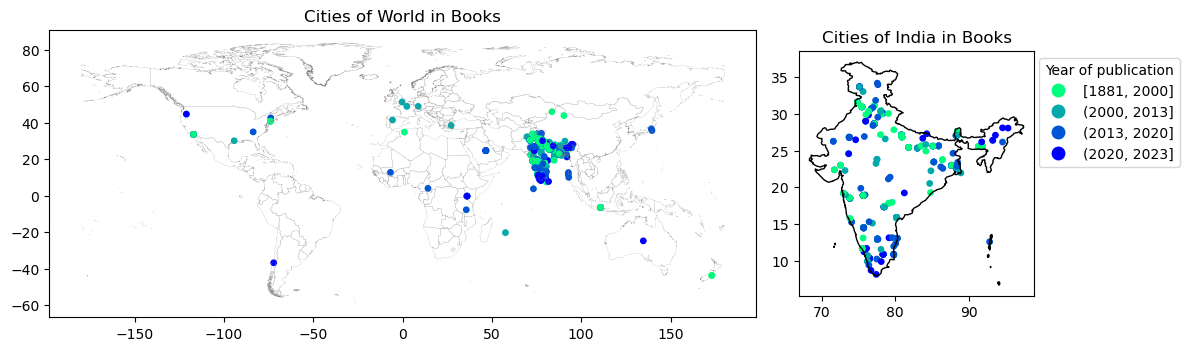
A previous colleague’s website CITIES IN FICTION has cities mentioned which I mapped. Take a look here
Visualizing incoming and outgoing migrants (2011) from each state in India
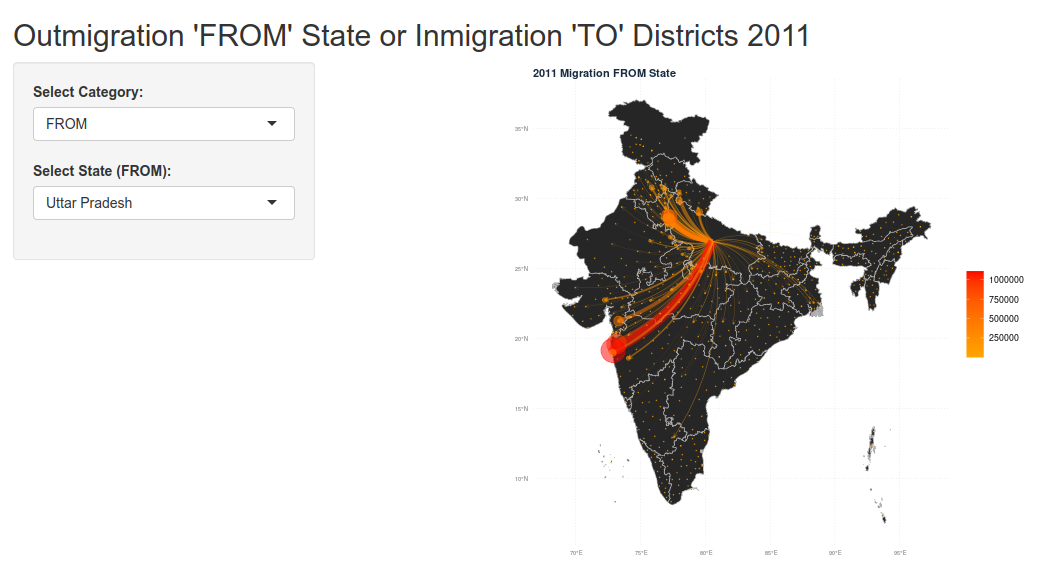
This project made me learn so many things! Helped me collaborate with some amazing people (scientists) and produced 1 publication (and one is on the way). Visualization link in here
Does economic development translate to spatial development?
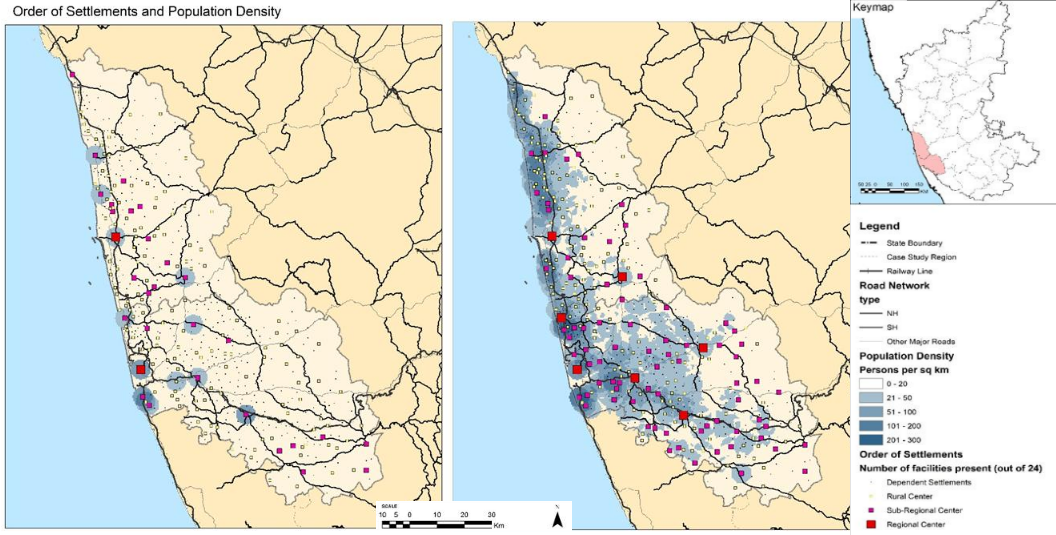
I wanted to do a cellular automata based (complex system) urban growth model but as there was no one to guide such a project, this is the second project I could think of. It was interesting nonetheless and allowed me to work with supervised satellite imagery classification, derive a hierarchy for settlements, and work with multi-variable regression analysis to try and answer the question: ‘Does economic development mean spatial development as well?’. Read more about it here
Crime and Physical Environment
This was a pet project turned into a Bachelors thesis project. It saw the correlation between crime and 42 physical factors including land use and the presence of lake/park, the literacy rate in the ward, etc. Read more about it here